
It’s sometimes useful to find the average length or size of a given field in Elasticsearch. It would help indicate the size taken up by a document, or help determine maximum lengths to be allowed and so on.
Unfortunately this is not a visualization built into Kibana, however it is possible to define an aggregation which calculates the statistics for a given field’s size.
For example, in the below request we query winlogbeat for the top 25 documents sorted by Event Code, and then calculate statistics for the szie of the “message” field in each:
GET /winlogbeat-*/_search
{
  "size": 0,
  "query": {
    "range": {
      "@timestamp": {
        "gte": "now-1h/h",
        "lte": "now"
      }
    }
  },
  "aggs": {
    "eventIDs":{
      "terms": {
        "field": "event.code",
        "size": 25
      },
      "aggs": {
        "length": {
          "stats": {
            "script": "if (doc['message'].size()>0) { return doc['message'].value.length()}"
          }
        }
      }
    }
  }
}
Note how we use the “terms” aggregation to find the top 25 event IDs, and then use the “stats” aggregation along with a “script“ condition to calculate the min, max, sum, count and average. The script is straightforward:
- First check if the “message” field exists in the document :
doc['message'].size()>0 - If that check passes, return the length of that
doc['message'].value.length()
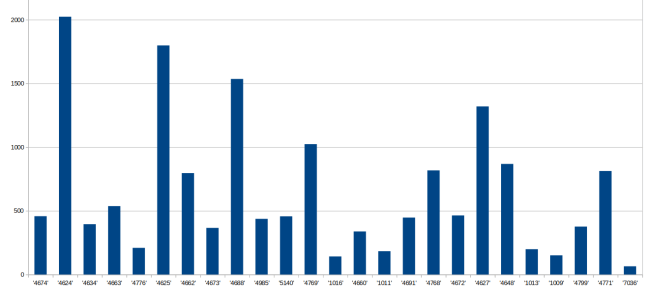
The results can be used to build your own visuals in something like Excel:


You must be logged in to post a comment.