
Calculating the 95th percentile of bandwidth used by a client is a common method of billing for ISP and service providers [1]. Hence, it is also of great interest to the client to plot these values as well to keep track of their service provider fees and double check bills.
Plotting the 95th percentile on Centreon is currently not very straightforward but it is possible without too much hassle once you know what to do. This article documents what you have to do to get a proper bandwidth plot both incoming traffic and outgoing traffic’s 95th percentile.
We assume that you already have a normal bandwidth graph showing traffic in / traffic out over an interface. Once you have this graph, perform the following steps:
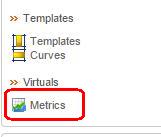
- Navigate to Views > Graphs > Virtuals > Metrics
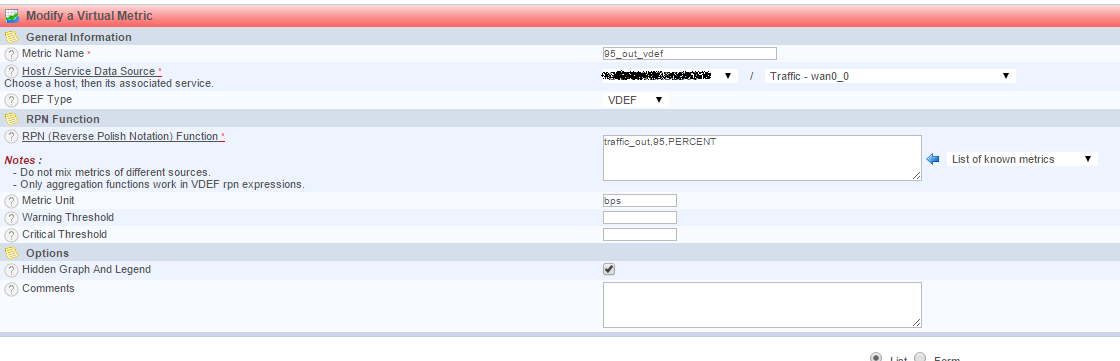
- Create a new metric. Enter a valid name, and select the host and service for which you’d like to plot the 95th percentile. Normally the host would be the internet facing router, and the interface would be the WAN interface
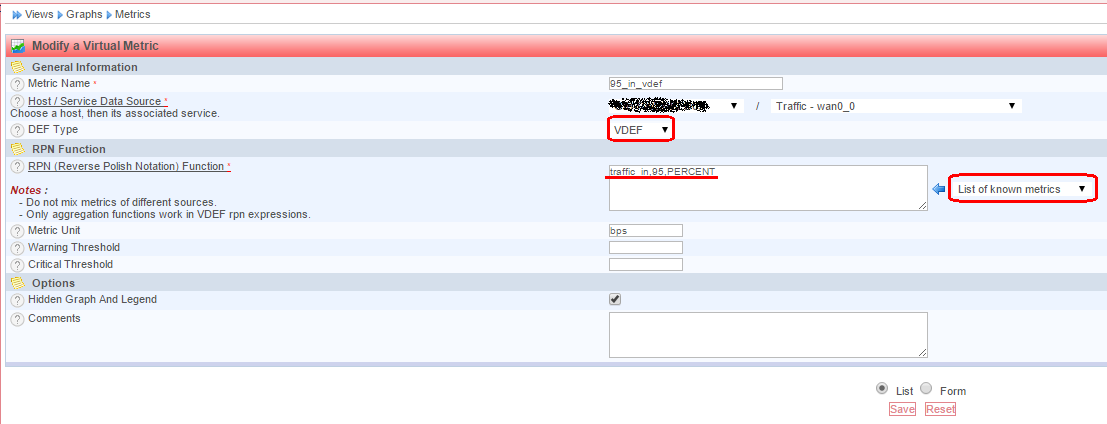
- Select a DEF type of VDEF. We use VDEF because the 95th percentile is calculated over an entire range of values, not on individual data points [2]
- As an RPN, enter the following:
traffic_in,95,PERCENT
Make sure there are no spaces in the above, else you will get an error. For those interested in what is going on above, RPN (reverse polish notation) works by using a “stack”. So the way to read the above is:
– “Push the ‘traffic_in’ dataset onto the stack”
– “Push the variable ’95’ onto the stack”
– “Calculate the result of the PERCENT function on the previous two values in the stack”
More details can be found here [3]
- Note that the “traffic_in” will probably need to change for a specific installation, depending on what you have named this variable. Use the “list of known metrics” to select the appropriate name
- Save the above metric. This will actually return the 95th percentile
Now, unfortunately centreon does not allow you to directly plot a VDEF (notice the”hidden graph” checkbox in the screenshot above? This cannot be de-selected). So we need to employ a little trick to turn this VDEF into a CDEF, which can be plotted. This is how that is done:
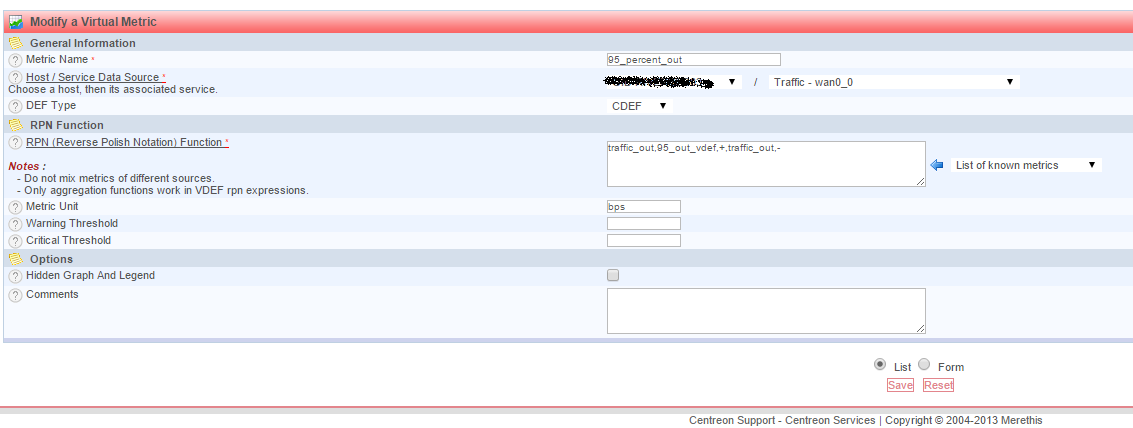
- Again create a new virtual metric, giving it an appropriate name
- Again select the same host and service you had previously used for the VDEF above.
- This time, select a DEF type of CDEF
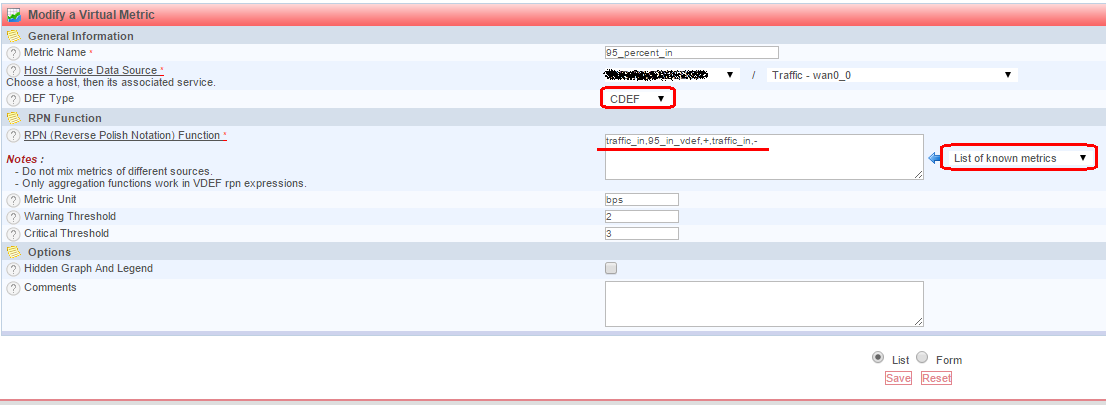
- Here’s the trick… in the RPN field, enter the following:
traffic_in,95_in_vdef,+,traffic_in,-
Again, make sure you have no spaces in the above. Also, note that “95_in_vdef” is actually the name of the vdef you previously created. It should be listed under “List of known metrics”. What we’re doing here is simple. Break down the RPN and it should be clearer:
traffic_in,95_in_vdef,+
This adds the individual data points of “traffic_in” (the traffic of the interface) to the “95_in_vdef” you previously calculated, and places the result back onto the stack. Now, we’re only really interested in the value of “95_in_vdef”, so we subtract the result of the above from traffic_in again to just leave 95_in_vdef, which is what “traffic_in,-“ is doing.
So in essence we have the following formula:
traffic_in + 95th percentile - traffic_in = 95th percentile
Now since it’s a CDEF, we can plot this. You need to do the same for traffic_out of course. First the VDEF:
Followed by the CDEF:
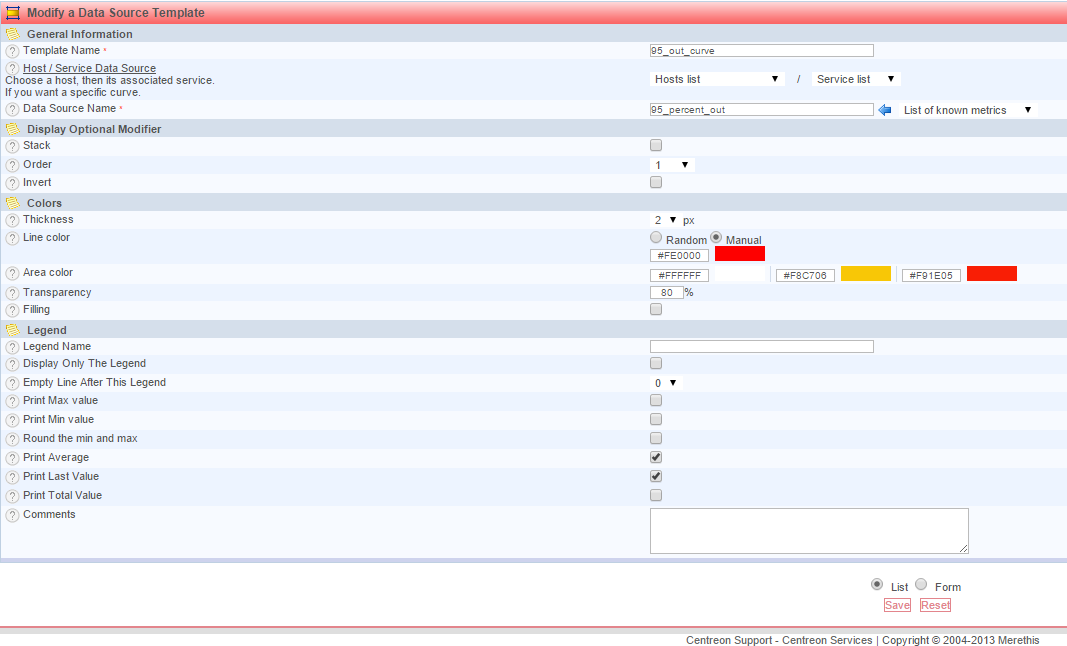
Now, one should modify the curve lines of the two CDEFs we just defined to make them pop out a little on the graphs. this is done via the “curves” option shown in the first screenshot above, for example, in the below, we set the color for 95_percent_out (our CDEF value for the outbound traffic 95th percentile) red:
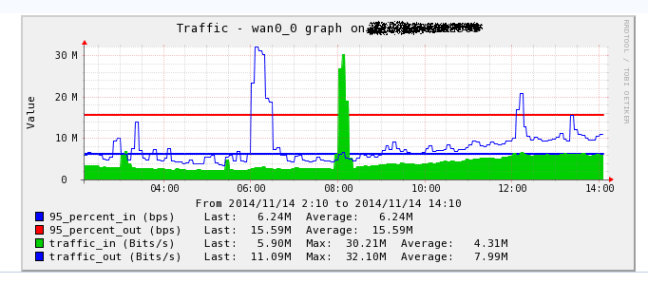
The result would be something like this:

Where you can see both inbound and outbound 95th percentile lines in blue and red respectively.
References
[1] http://en.wikipedia.org/wiki/Burstable_billing
[2] http://oss.oetiker.ch/rrdtool/doc/rrdgraph_data.en.html#___top

One thought on “Plotting the 95th percentile using Centreon”
Comments are closed.