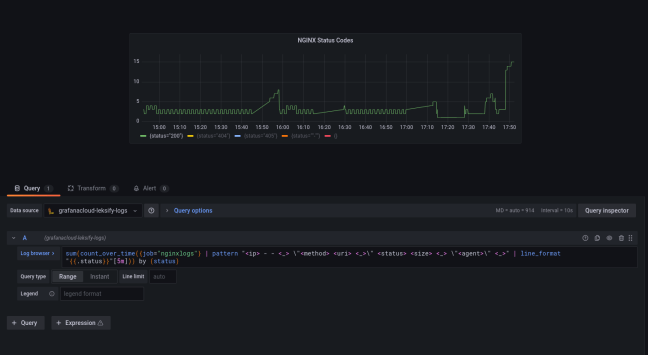
Grafana Loki (https://grafana.com/oss/loki/) looks like a viable alternative to Elasticsearch and has an excellent pedigree, but how does it stack up with Elasticsearch, especially when using it in a SOC perspective? Getting Setup This was a breeze compared to Elasticsearch (which itself is also really simple to setup). The test stack consisted of Promtail to … Continue reading Grafana Loki coming from Elasticsearch : Extracting Visuals
Grafana Loki coming from Elasticsearch : Extracting Visuals


You must be logged in to post a comment.