
Apache Nifi is the result of an project open-sourced by the NSA. It’s described as a “data traffic program”… For users familiar with the Elastic ecosystem, think of it as a GUI-enabled mashup of Filebeat, Winlogbeat and Logstash. In essence Nifi allows you to build data processing pipelines of arbitrary complexity and enrich the data or route it to different destination using a huge array of included “processors”
In this article we’ll explore how to use NiFi to setup an ingress data pipeline that receives data via syslog, groks the data, and indexes the data into Elasticsearch. In essence, very similar to what Logstash would do, with a few advantages:
- GUI – makes data flows easy to visualize and monitor
- Distributed setup. Nifi can easily be expanded into a cluster, scaling throughput horizontally
- Route-able actions: take different actions depending on the data passing through the pipeline, like sending emails or slack notifications
- Write your own processors in a slightly wider variety such as Python, JavaScript, Java, and others
The overall architecture is going to look something like this:

All the processors shown come standard as part of the NiFi package (even the “ExtractGrok” processor!), except for CyberSiftGeoIP, which is a custom package that we built to show how easy it is to build custom processors in a future article. Let’s examine each processor in the pipeline, starting from the top left corner:
ListenSyslog
This processor is straightforward to setup. Simply decide which port and protocol to listen on in order to receive syslog. In our case we chose the standard UDP, listening on port 5114. We’ll send test syslog messages to this processor using the linux logger command
ExtractGrok
The ListenSyslog processor is connected to the Grok processor; which if you’re an Elasticsearch/Logstash user, should excite you since it allows you to describe grok patterns to extract arbitrary information from the syslog you receive. In order to build our Grok pattern, first let’s examine the syslog output of our logger command:

The above command will result in a log message similar to this:
<13>1 2018-09-18T10:13:40.908149+03:00 dvas0004-VM60 dvas0004 - - [timeQuality tzKnown="1" isSynced="1" syncAccuracy="753500"] testing 123 8.8.8.8
There are a number of valid grok patterns we can build, the one we’ll use in this article is as follows:
<13>1 %{TIMESTAMP_ISO8601:timestamp8601} %{GREEDYDATA:hostname} %{DATA:user} - - \[timeQuality tzKnown="1" isSynced="1" syncAccuracy="%{NUMBER}"\] %{GREEDYDATA:message} %{IP:ip}
It’s generally easier to use a grok debugger like https://grokdebug.herokuapp.com/ when designing your grok patterns. We insert that grok expression into the appropriate processor property as shown below:

Note the property “Destination” is set to “flowfile-attribute” which means that any matched patterns will be inserted as new attributes with the prefix “grok.attribute-name“. For example, the GREEDYDATA stored in “message” shown in the grok expression will be stored as “grok.message”. We’d like to get rid of this prefix, this leads us to the next processor in the pipeline
UpdateAttribute
We use this processor for two functions:
- Rename attributes (typically to get rid of the prefixes introduced by other processors
- Retain only those attributes we’re interested in

Notice how we set the “Delete Attributes Expression” to “.*”, to delete all the attributes – but we also set a few custom properties which will be retained. Custom properties are added by using the “+” button in the top right corner. The property can be named whatever you’d like, and it’s value set to whatever you need. In the screenshot above, the “message” property is being set to the message field in the grok output by using the NiFi expression language (which is similar to Elastic’s Painless). Note how we can access different fields from the data by using ${field_name}
LogAttribute
For now we’ll skip the custom “CyberSiftGeoIP” processor and cover that in another article. The CyberSiftGeoIP adds a new attribute which converts a given IP address to it’s originating country using MaxMind’s GeoLite databases. We will however mention the “LogAttribute” processor since it’s useful for debugging and keeping tabs on the output of different processors. The log attribute processor logs all received data to the nifi-app.log, and outputs something like the below:

This makes it easy to keep tabs on how attributes evolve as data flows down the pipeline. Having enriched and logged our data, we now proceed to get the data ready to send to Elasticsearch. The PutElasticsearchHttp processor only accepts JSON encoded data, so we first need to pass our data through the following module.
AttributesToJSON
This module is straightforward to configure, as can be seen below:

Since we want to send all attributes to ElasticSearch, we set the “Attributes Regular Expression” to “.*”. There is one caveat here; we set “Destination” to “flowfile-content”, simply because that’s what the PutElasticsearchHttp processor expects.
PutElasticsearchHttp
To anyone who’s used ElasticSearch before, this processor will be easy to configure:
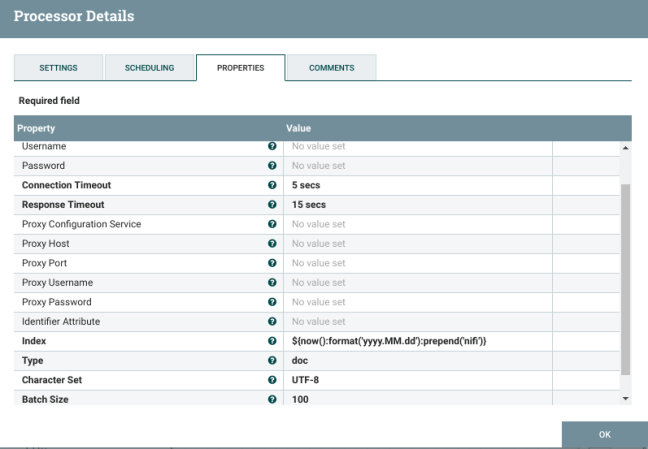
Fill in the Elasticsearch URL, Type, and index. We’d like to draw attention to how we setup the Index property. Note how we used the NiFi expression language to push data to a dynamic index which has a similar naming structure to those used by filebeat, winlogbeat, etc. The expression is:
${now():format('yyyy.MM.dd'):prepend('nifi-')}
The now() function outputs the current date and time. This output is chained using the : operator to the format function which formats our date appropriately. Now we prepend this with “nifi-“, resulting in an index name similar to “nifi-2018.09.25”, which is very similar to those we’re familiar with in ELK deployments.
That’s it! Sending data to the syslog listener results in it being enriched and indexed into Elasticsearch:


2 thoughts on “Apache NiFi: From Syslog to Elasticsearch”
Comments are closed.